LSST Applications  21.0.0-172-gfb10e10a+18fedfabac,22.0.0+297cba6710,22.0.0+80564b0ff1,22.0.0+8d77f4f51a,22.0.0+a28f4c53b1,22.0.0+dcf3732eb2,22.0.1-1-g7d6de66+2a20fdde0d,22.0.1-1-g8e32f31+297cba6710,22.0.1-1-geca5380+7fa3b7d9b6,22.0.1-12-g44dc1dc+2a20fdde0d,22.0.1-15-g6a90155+515f58c32b,22.0.1-16-g9282f48+790f5f2caa,22.0.1-2-g92698f7+dcf3732eb2,22.0.1-2-ga9b0f51+7fa3b7d9b6,22.0.1-2-gd1925c9+bf4f0e694f,22.0.1-24-g1ad7a390+a9625a72a8,22.0.1-25-g5bf6245+3ad8ecd50b,22.0.1-25-gb120d7b+8b5510f75f,22.0.1-27-g97737f7+2a20fdde0d,22.0.1-32-gf62ce7b1+aa4237961e,22.0.1-4-g0b3f228+2a20fdde0d,22.0.1-4-g243d05b+871c1b8305,22.0.1-4-g3a563be+32dcf1063f,22.0.1-4-g44f2e3d+9e4ab0f4fa,22.0.1-42-gca6935d93+ba5e5ca3eb,22.0.1-5-g15c806e+85460ae5f3,22.0.1-5-g58711c4+611d128589,22.0.1-5-g75bb458+99c117b92f,22.0.1-6-g1c63a23+7fa3b7d9b6,22.0.1-6-g50866e6+84ff5a128b,22.0.1-6-g8d3140d+720564cf76,22.0.1-6-gd805d02+cc5644f571,22.0.1-8-ge5750ce+85460ae5f3,master-g6e05de7fdc+babf819c66,master-g99da0e417a+8d77f4f51a,w.2021.48
LSST Data Management Base Package
Public Member Functions | Public Attributes | List of all members
lsst.display.matplotlib.matplotlib.AsinhZScaleNormalize Class Reference
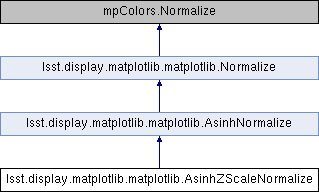
Inheritance diagram for lsst.display.matplotlib.matplotlib.AsinhZScaleNormalize:
lsst.display.matplotlib.matplotlib.AsinhNormalize lsst.display.matplotlib.matplotlib.Normalize

Public Member Functions

def __init__ (self, image=None, Q=8)
 
def __call__ (self, value, clip=None)
 

Public Attributes

 mapping
 

Detailed Description

Provide an asinh stretch using zscale to set limits for mtv()

Definition at line 841 of file matplotlib.py.

Constructor & Destructor Documentation

◆ __init__()

def lsst.display.matplotlib.matplotlib.AsinhZScaleNormalize.__init__ (   self,
  image = None,
  Q = 8 
)
Initialise an object able to carry out an asinh mapping

@param image  image to use estimate minimum and dataRange using zscale
              (see AsinhNormalize)
@param Q Softening parameter (default: 8)

See Lupton et al., PASP 116, 133

Definition at line 843 of file matplotlib.py.

843  def __init__(self, image=None, Q=8):
844  """Initialise an object able to carry out an asinh mapping
845 
846  @param image image to use estimate minimum and dataRange using zscale
847  (see AsinhNormalize)
848  @param Q Softening parameter (default: 8)
849 
850  See Lupton et al., PASP 116, 133
851  """
852 
853  # The object used to perform the desired mapping
854  self.mapping = afwRgb.AsinhZScaleMapping(image, Q)
855 
856  vmin, vmax = self._getMinMaxQ()[0:2]
857  # n.b. super() would call AsinhNormalize,
858  # and I want to pass min/max to the baseclass
859  Normalize.__init__(self, vmin, vmax)
860 
861 

Member Function Documentation

◆ __call__()

def lsst.display.matplotlib.matplotlib.Normalize.__call__ (   self,
  value,
  clip = None 
)
inherited
Return a MaskedArray with value mapped to [0, 255]

@param value Input pixel value or array to be mapped

Definition at line 791 of file matplotlib.py.

791  def __call__(self, value, clip=None):
792  """
793  Return a MaskedArray with value mapped to [0, 255]
794 
795  @param value Input pixel value or array to be mapped
796  """
797  if isinstance(value, np.ndarray):
798  data = value
799  else:
800  data = value.data
801 
802  data = data - self.mapping.minimum[0]
803  return ma.array(data*self.mapping.mapIntensityToUint8(data)/255.0)
804 
805 

Member Data Documentation

◆ mapping

lsst.display.matplotlib.matplotlib.AsinhZScaleNormalize.mapping

Definition at line 854 of file matplotlib.py.


The documentation for this class was generated from the following file: